The following article introduces a solution that focuses on the performance monitoring of applications, services, and other selected elements.
The solution is a comprehensive system of connecting several tools, which are then used to evaluate the performance of individual processes and to display the results in Grafana.
All elements will be described and explained step by step.
The purpose of this article is not only to outline the entire subject, but also to help with the actual implementation of the complete solution. It will not only be able to monitor the system load, but also to visualize it in a graph with the possibility to trace back how the whole system behaves and how it is “consuming” hardware resources.
The whole solution consists of three elements, or applications: Telegraf, InfluxDB and Grafana.
Telegraf
The most important element, which is the core of the whole solution, is Telegraf.
This is a service (agent) that allows us to collect performance data and metrics from the system on which it is running.
It can monitor arbitrary services and processes running on that system. All collected data is stored as time series data and then stored in a database. Telegraf can store data in various types of storage. In our case we use InfluxDB, which is able to send data to other repositories, datastores, etc. In our case, we use storing to InfluxDB, which I will mention later.
Telegraf itself is designed to cause minimal memory load on the system (computer) it runs on, but at the same time to provide developers with a wide range of services and interfaces it is able to communicate with.
Telegraf is therefore a handy helper that helps us get metrics from the processes we are monitoring and then store them in the InfluxDB database. However, it can also monitor various data from database systems, HW sensors, IoT sensors, etc.
InfluxDB
Influx DB is a database designed for collecting time series data. The solution is designed to allow very fast writing of the collected data. At the same time, it also – of course – enables very fast reading.
Grafana
In order to have a complete introduction, I will mention one last part of the solution, which is Grafana.
Grafana is an open-source tool used to visualize collected metrics and analytical data. It is most commonly used just to visualize time series, but it is also used in other areas including industrial sensors, IoT, weather sensors, etc.
We will discuss its detailed description and setup later.
Installation – InfluxDB
Before setting up and installing any monitoring agent, it is important to first have a “time series” database ready for data collection, without which the entire system would not be complete, i.e. functional. As mentioned above, we will use InfluxDB.
So let’s take a brief look at the actual installation and configuration:
Installing and creating the database
The installation of InfluxDB is easy and as usual starts with downloading the binaries. For example, version 1.8 can be found here. Save the downloaded .zip file and extract it to your computer.
Run the command prompt and navigate to the folder where you saved the binaries (in my case directly in Program Files). You will then see several files in there:
- influx.exe: a CLI executable used for easy database navigation and measurement
- influxd.exe: used to run an instance of InfluxDB on the computer
- influx_stress.exe: an executable used to run stress tests on the computer;
- influx_inspect: used to check disks and InfluxDB (we don’t use it in our case).
- Influxdb.conf: configuration file
In our case, we want to run the influxd file: C:\Program Files\influxdb>influxd.exe
Once we see the following, everything is fine.
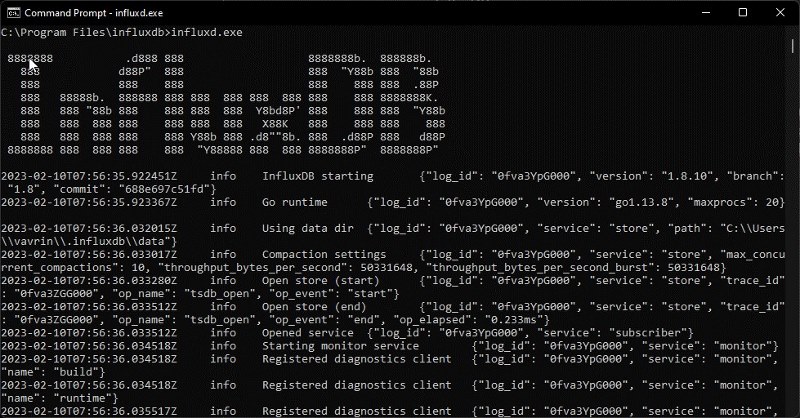
Once we have an influxDB instance running on our computer, we use influx.exe to start a power shell session with an open connection to our InfluxDB instance.

Creating a database
Now we may continue with simple database commands:
- “SHOW DATABASES”, which lists the available databases. After that, the most important thing is to create our new database, which we will then fill with data:
- “CREATE DATABASE name” (in our case, e. g., “CREATE DATABASE telegraph”)
- To check this, we will use the “SHOW DATABASES” command again.
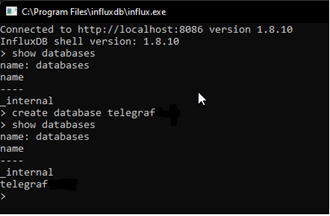
Now we have a database ready to be filled with the data collected by the Telegraph.
Telegraf installation
The installation of Telegraf is a straightforward process, requiring only the download, creation of a dedicated folder and the installation of the application as a system service.
As the first step, you need to download the Telegraf software.
- So we go to the following link: https://portal.influxdata.com/downloads
- We select the current version of Telegraf and our desired platform.
- Then we just need to unzip the files into the appropriate folder.
- I recommend to unzip the files into the Program Files folder, and to create a subfolder called Telegraf in there.
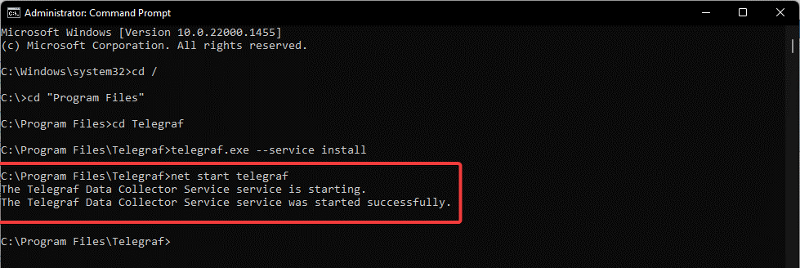
- The installation itself is then performed by running the command prompt, navigating to the folder with the location of your choice (in this case C:/ProgramFiles/Telegraf/)
- And then run the command:
C:/ProgramFiles/Telegraf/telegraf.exe --service install - This will install the Telegraf software as a service.
- To authenticate and start the service, we then use the command: “
net start telegraf“
Telegraf Configuration
The default Telegraf configuration file is part of the downloaded installation package. However, you must modify it according to your own needs.
This is the file “telegraf.conf”, located in the folder together with “telegraf.exe”.
All the settings are broken down in it and also explained quite meaningfully. Some settings are commented out with a # character, which must be removed if we want to use the setting.
We will be most interested in the outputs section (“Outputs”), where we set the place to store the collected data, and the inputs section (“Inputs”), where we set what data we want to collect.
Output
In this section we need to set where we want to send the data, i.e. specify our existing InfluxDB database.
In our case, the solution is running on the server, so as output we have the address of the Influx instance.
So we need to specify the address where the database is running. If the instance is running on the same machine, the address will be “urls=[“http://127.0.0.1:8086″]”
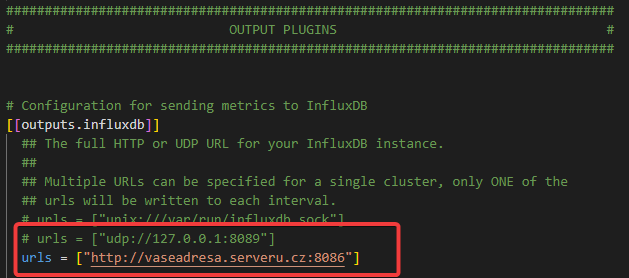
The most important item in this section is configuring the correct database where we want to collect data and then specifying where our output is.
[[outputs.influxdb]]
urls = ["http://Your-Server-IP:8086"] # required.
database = "telegraf" # required.
Input
The “input” section is used to define the areas of data we want to monitor and collect.
We therefore need to think about what we want to monitor. The configuration itself already contains a large number of predefined counters that we can easily use. We just need to “uncomment” the specific rows and start using what we need.
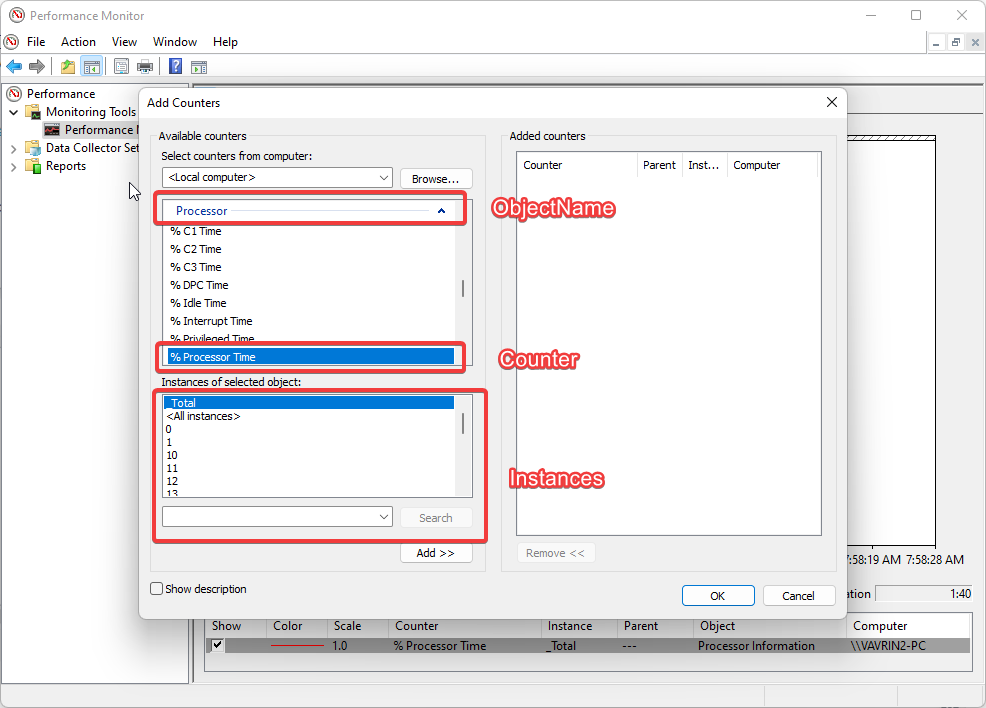
The individual counters behave similarly to the Windows Performance Monitor. Their naming is the same and they are also divided into the same sections. We will explain this in the figure below:

We can see the counter description for the “Processor” object and the individual counters then represent items such as “% Idle Time“, “% Interupt Time” etc.
If we want to add a counter for Processor Time, for example, we simply add a “% Processor Time” item to the telegraph configuration among the “Counters“.
The item and the override: “Instances = [“*”]” means that we want to select all running instances, not for example to define exactly the individual running services.
As an explanation, here is an image from the Windows Performance Monitor.
General (Agent)
This section is mainly used to configure general settings in Telegraf. For example, we can set the data collection interval, which is one of the most important data for us.

We can also set for example the size of the buffer, etc.
metric_buffer_limit = 10000
metric_batch_size = 1000
If we want to set logging as well, we need to specify the path to the log file and also other parameters for logging.
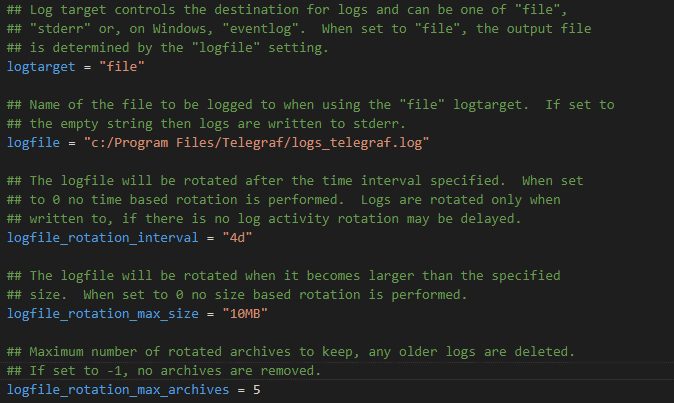
Even this minimally modified configuration is sufficient for our purposes. For further modifications we can use the Telegraf website, where the whole configuration is well documented.
So now we are ready for data collection and our Telegraf is already starting to monitor the performance of our system.
In the following article we are going to talk about the Grafana setup, with which we will be able to display the individual results very elegantly and thus we will be able to see what the performance of our system looks like in real time.
We can thus very efficiently track the impact of individual programs, services, or anything else on our system.


